Scientific observations and results from Antarctica shallbe exchanged and made freely available
This dataset was generated for Choi et al. (2021) using NCEP/NCAR reanalysis 1000 hPa temperature data (Kalnay et al., 1996) from 1 July 1957 to 30 June 2013. It provides composite mean values of the 3-day running-mean 1000 hPa temperature anomaly, averaged over Scandinavia/Northern Europe (40E-40W, 60N-75N) for each SSW type (DD, DS, SS). The dataset includes 61 daily values from day –30 to day +30 relative to the SSW onset date. Anomalies are defined relative to the 1981–2010 climatology. SSW types follow the classification of Choi et al. (2019), and the associated dataset is available in KPDC (KOPRI-KPDC-00003036). Choi, H., Kim, B. M., & Choi, W. (2019). Type classification of sudden stratospheric warming based on pre-and postwarming periods. Journal of climate, 32(8), 2349-2367. Choi, H., Kim, J. H., Kim, B. M., & Kim, S. J. (2021). Observational evidence of distinguishable weather patterns for three types of sudden stratospheric warming during northern winter. Frontiers in Earth Science, 9, 625868. Kalnay, E., Kanamitsu, M., Kistler, R., Collins, W., Deaven, D., Gandin, L., ... & Joseph, D. (2018). The NCEP/NCAR 40-year reanalysis project. In Renewable energy (pp. Vol1_146-Vol1_194). Routledge.
This dataset was generated for Choi et al. (2021) using NCEP/NCAR reanalysis 1000 hPa temperature data (Kalnay et al., 1996) from 1 July 1957 to 30 June 2013. It provides composite mean values of the 3-day running-mean 1000 hPa temperature anomaly, averaged over North America (80-120W, 40-55N) for each SSW type (DD, DS, SS). The dataset includes 61 daily values from day –30 to day +30 relative to the SSW onset date. Anomalies are defined relative to the 1981–2010 climatology. SSW types follow the classification of Choi et al. (2019), and the associated dataset is available in KPDC (KOPRI-KPDC-00003036). Reference Choi, H., Kim, B. M., & Choi, W. (2019). Type classification of sudden stratospheric warming based on pre-and postwarming periods. Journal of climate, 32(8), 2349-2367. Choi, H., Kim, J. H., Kim, B. M., & Kim, S. J. (2021). Observational evidence of distinguishable weather patterns for three types of sudden stratospheric warming during northern winter. Frontiers in Earth Science, 9, 625868. Kalnay, E., Kanamitsu, M., Kistler, R., Collins, W., Deaven, D., Gandin, L., ... & Joseph, D. (2018). The NCEP/NCAR 40-year reanalysis project. In Renewable energy (pp. Vol1_146-Vol1_194). Routledge.
This dataset was calculated during the research conducted for Choi et al. (2024) and provides June–August (JJA) surface air temperature anomalies averaged over the entire Antarctic continent (0–360°E, 90°S–70°S) for the period 1979–2022. The anomalies were computed relative to the 1979–2022 climatology. Reference Choi, H., Kwon, H., Kim, S. J., & Kim, B. M. (2024). Warmer Antarctic summers in recent decades linked to earlier stratospheric final warming occurrences. Communications Earth & Environment, 5(1), 50. Tetzner, D., Thomas, E., & Allen, C. (2019). A validation of ERA5 reanalysis data in the Southern Antarctic Peninsula—Ellsworth land region, and its implications for ice core studies. Geosciences, 9(7), 289.
This dataset presents a new catalogue of active subglacial lakes beneath Thwaites Glacier, West Antarctica, identified using CryoSat-2 satellite radar altimetry. It details the boundaries, areas, and elevation changes of each lake, complete with 95% confidence intervals. The dataset also contains estimates of ice speed changes in the TG's grounding zone. For citation purposes, refer to the article by B-H Kim, C-K Lee*, K-W Seo, W S Lee, and J-W Park, 'New Catalogue of Thwaites Glacier Subglacial Lakes and Their Activity Revealed by CryoSat-2 Altimetry,' currently under revision for the Journal of Geophysical Research: Earth Surface. For more information, Dr. Choon-Ki Lee can be contacted at cklee@kopri.re.kr.
This dataset consists of high-precision GNSS observation data collected from January to May 2025 at King Sejong Station, King George Island, Antarctica. The data can be used for monitoring crustal movements, surface stability, and glacial displacement in polar geophysical research.
The tidal observation equipment at the King Sejong Station in Antarctica was installed by the Korea Hydrographic and Oceanographic Agency in December 2019. The equipment measures tidal waves at 1-minute intervals by measuring changes in water pressure according to sea level height in harsh Antarctic environments such as sea ice.
King Sejong Station more infomation
Barton Peninsula, King George Island, AntarcticaJang Bogo Station more infomation
Terra Nova Bay, Northern Victoria Land, AntarcticaDasan Station more infomation
NyÅlesund, Norway, Europelast 5 years data
Since 2010
last 5 years data
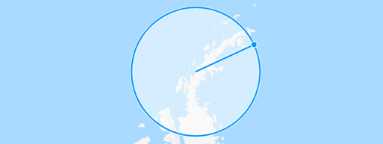
Select a Circle or Square

Click the play button

On the map, click Set Area Center

Drag to adjust
Click again to quit

Click the search button and you will only be able to search results within the area.
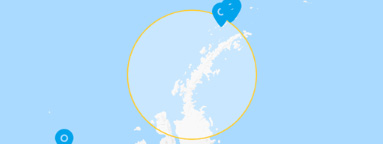
* Click the Stop button to cancel