Scientific observations and results from Antarctica shallbe exchanged and made freely available
Dataset: Ground Penetrating Radar (GPR) Data Location: Elephant Moraine, Antarctica Acquisition Date: January 6, 2022 Objective: Investigation of internal ice layer boundaries Reference: Please refer to the 2016 survey info.xlsx file for comprehensive details.
Species list of benthic organisms in Ross Sea, Antarctica (2025-2026)
Atmospheric CO2 concentration measurement started using a Wavelength-Scanned Cavity Ring Down Spectroscopy(WS-CRDS) at the Antarctic King Sejong Station in January of 2010. In October of 2010, CO2 concentration was involved as one of key constituents at the King Sejong station as GAW regional station. For quality assurance, routine managements of the system and its regular calibration using national standard CO2 gases of two-levels have been made at the site. In addition, dehumidification device is used to remove water vapor in the air sample before the sample arrives in the CRDS. Continuous monitoring of accurate and precision atmospheric CO2 concentration at King Sejong Station near the Antarctic Peninsula
This dataset presents a new catalogue of active subglacial lakes beneath Thwaites Glacier, West Antarctica, identified using CryoSat-2 satellite radar altimetry. It details the boundaries, areas, and elevation changes of each lake, complete with 95% confidence intervals. The dataset also contains estimates of ice speed changes in the TG's grounding zone. For citation purposes, refer to the article by B-H Kim, C-K Lee*, K-W Seo, W S Lee, and J-W Park, 'New Catalogue of Thwaites Glacier Subglacial Lakes and Their Activity Revealed by CryoSat-2 Altimetry,' currently under revision for the Journal of Geophysical Research: Earth Surface. For more information, Dr. Choon-Ki Lee can be contacted at cklee@kopri.re.kr.
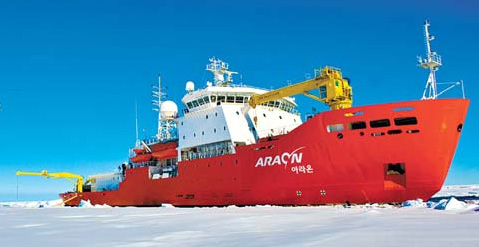
Seismic surveys were conducted over the southwestern continental slope of the Chukchi Rise, where physical gas hydrate samples have been recovered, and over adjacent seamount structures. The objective was to characterize the subsurface geological structures and to confirm the distribution of gas hydrates in the study area. To enable reliable interpretation of the seismic sections, data processing included noise attenuation and trace balancing. Strong vertical noise generated during ice-breaking operations and ice-avoidance maneuvering was suppressed. In addition, balancing procedures were applied to reduce interpretation uncertainty caused by lateral discontinuities and amplitude variations along the profiles.
This dataset consists of high-precision GNSS observation data collected from January to May 2025 at King Sejong Station, King George Island, Antarctica. The data can be used for monitoring crustal movements, surface stability, and glacial displacement in polar geophysical research.
King Sejong Station more infomation
Barton Peninsula, King George Island, AntarcticaJang Bogo Station more infomation
Terra Nova Bay, Northern Victoria Land, AntarcticaDasan Station more infomation
NyÅlesund, Norway, Europelast 5 years data
Since 2010
last 5 years data
Select a Circle or Square

Click the play button

On the map, click Set Area Center

Drag to adjust
Click again to quit

Click the search button and you will only be able to search results within the area.
* Click the Stop button to cancel